.png?width=615&height=570&name=Emissions%20measurement%20and%20response%20(1).png)
HOW WE HELP
Easily integrate measurement into your emissions program
Aggregate data
Integrate and consolidate emissions and operational measurement sources into a single source of truth.Detect emissions events
Use third-party emissions measurement and real-time operational data to identify events.Deploy field response
Deploy field teams to inspect emissions events and repair identified issues. Ensure results are captured, validated, and contextualized.Monitor your program
Compare top-down and bottom-up emissions. Visualize emissions events on a map tied to field response programs or operational data.Analyze and quantify
Quantify emissions using a combination of measurement and calculations, facilitate root cause analysis, and produce reconciled emissions totals.
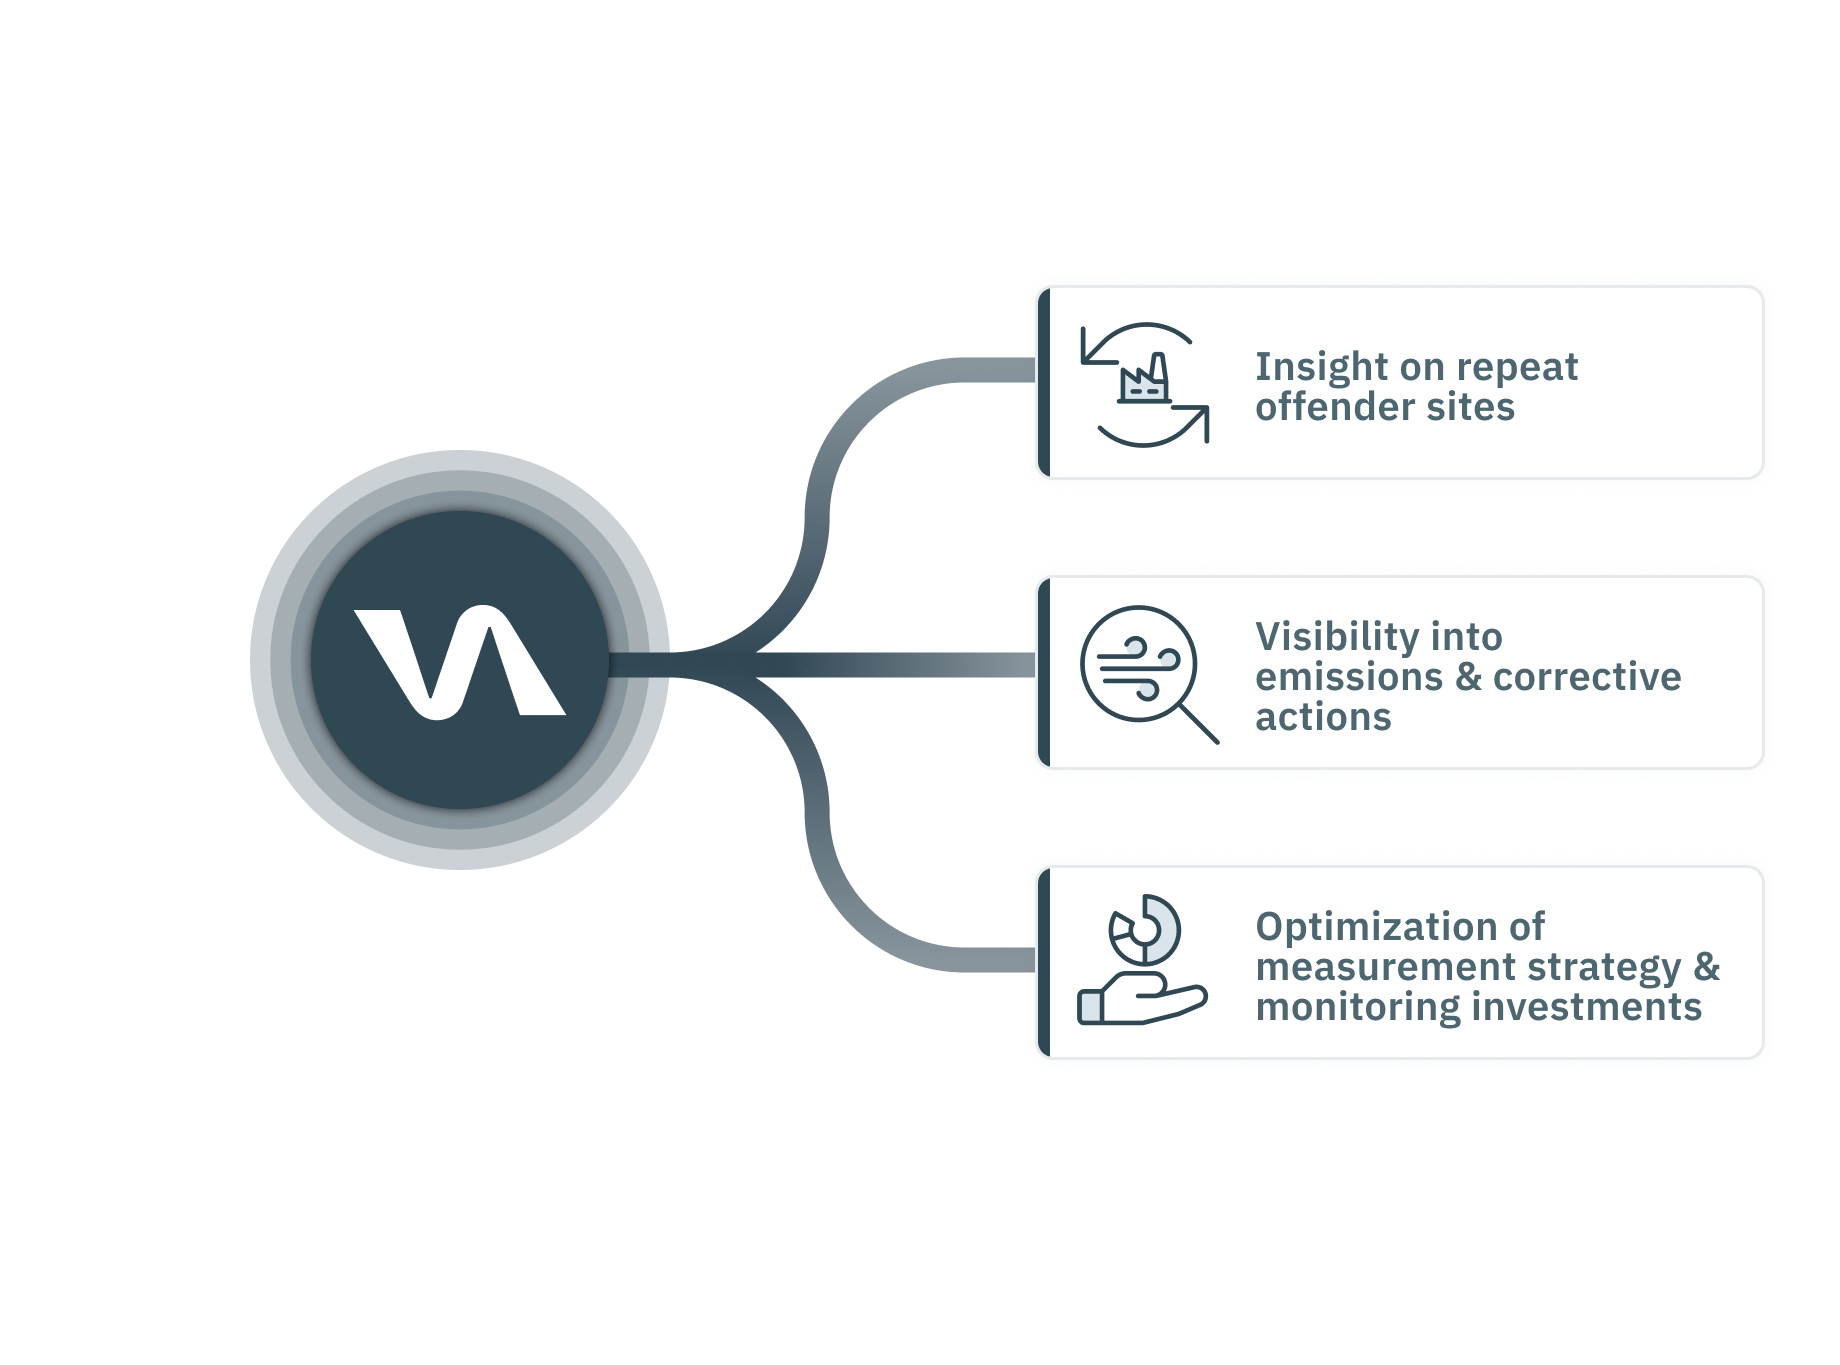
Integrate measurement for evolving requirements
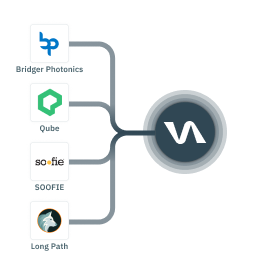
Integrate methane monitoring devices including fenceline monitors, tower methane sensors, handheld devices, SCADA-connected devices
Integrate top-down measurements including aerial flyovers, drone flyovers, and satellites
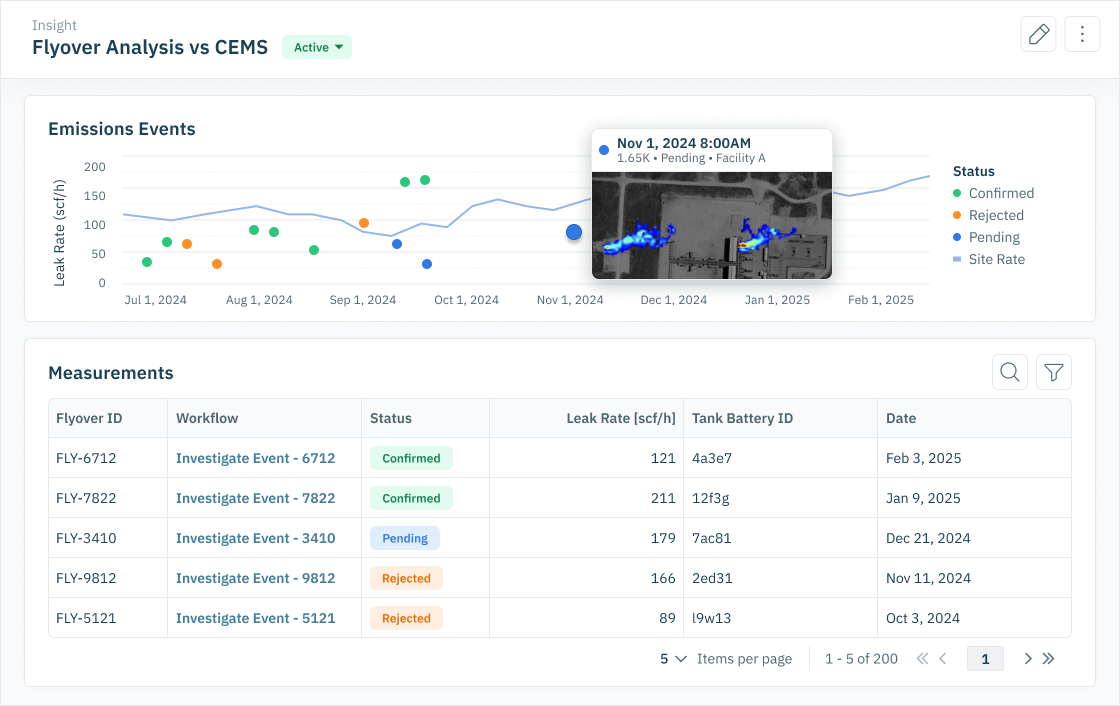
Emissions event response and quantification
Top down measurement comparison and analysis
Leak quantification
Source specific factors
Case study
Achieving efficiency and cost savings with emissions data integration
Challenges
Siloed Data, ad-hoc analysis
- Producer faced challenges consolidating and analyzing diverse emissions measurement data (Soofie, ChampoinX, Bridger, etc.) to optimize their emissions measurement strategy.
- Identifying repeat offender sites and prioritizing corrective actions required time-consuming, manual analysis of disparate data sources.
OUTCOMES
Efficient operations, improved decision making
- Validere's dashboards helped field ops teams identify repeat offender sites, streamlining workflows and saving time.
- Improved visibility into emissions and corrective actions enabled timely repairs, minimizing regulatory costs.
- The producer gained valuable insights on optimizing measurement strategies and future investments.
Book an intro
Talk to an expert to see how Validere can supercharge your team.