
Emissions > Regulatory Air and GHG reporting
Air and GHG reporting for an evolving regulatory landscape
Reporting frameworks include:
- US EPA GHGRP
- US EPA Air Emissions Reporting Requirements
- Canadian Federal GHGRP
- EU Methane Rules
- Colorado Department of Public Health and Environment Oil and Natural Gas Annual Emission Inventory Reporting
- New Mexico Environmental Department - Ozone Precursor Rule
- California Air Resources Board Mandatory Reporting requirements
- Wyoming Department of Environmental Quality Emissions Inventories
- Alaska Air Emissions Inventory & Reporting
- TCEQ Environmental Reporting
- Alberta TIER
- British Columbia GHGRP
- Alberta One Stop
- Fuel, Flare, Vent Reporting
- NPRI - National Pollutant Release Inventory
.webp?width=2000&name=Screen-1%20(1).webp)
Case study
Oil and gas producer gains clarity and control over emissions
Challenges
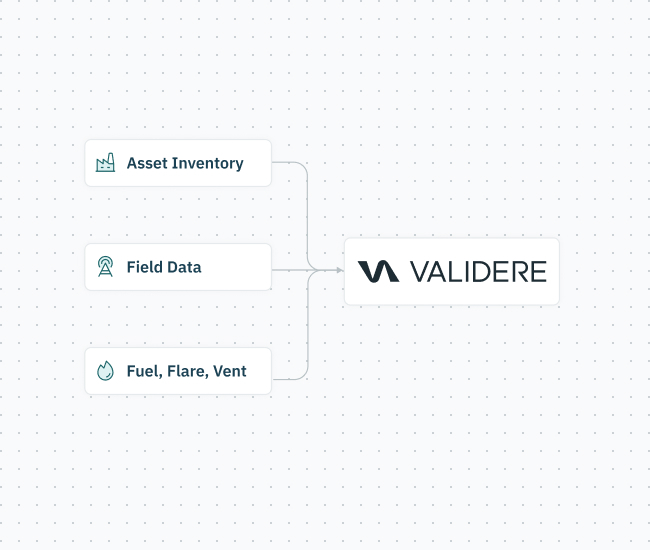
Dispersed data, lack of visibility
2,500+ well sites generating massive amounts of emissions data scattered across several systems.
Difficulty understanding emissions profile and identifying key sources.
Limited ability to proactively manage regulatory compliance.
OUTCOMES
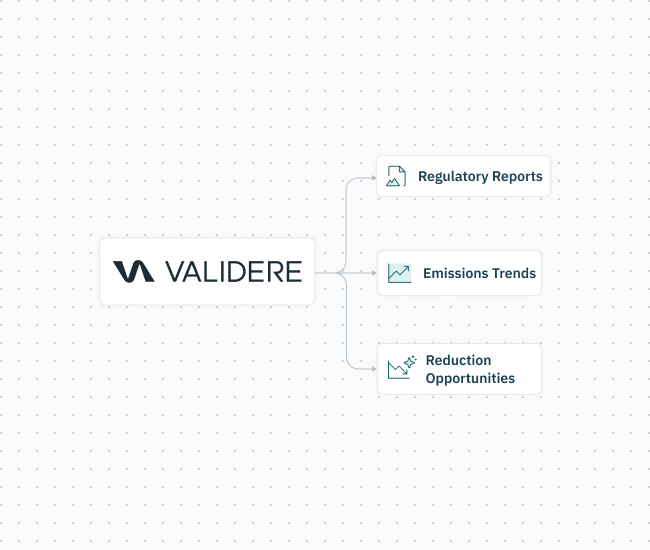
Streamlined reporting, clear insights
Significantly reduced quantification and reporting efforts through data integration and automation.
Clear understanding of emissions profile and trends, enabling informed decision making for emissions reduction projects.
Accurate and timely regulatory reporting.

Request a demo
Talk to an expert to see how Validere can supercharge your team.
Trusted by industry leaders & innovators


%201.svg.svg)


