
Since methane is a GHG that is 25 times more potent than carbon dioxide and only lasts about 10 years in the atmosphere, it represents the most significant and immediate opportunity to slow down the effects of climate change. This is why, in 2021, over 400 companies from more than 100 countries made the methane pledge to reduce these emissions by 45-55%.
Due to these commitments from governments and financial institutions, operators must consider reducing their methane emissions in order to avoid regulatory penalties and maintain access to capital. In response to these pressures, the energy industry must take immediate action to understand and quantify their methane intensity — a normalized measurement of methane emissions.
What is methane intensity and how is it measured?
Methane emissions are calculated based on the methane intensity (MI), which measures how well a facility performs as a ratio of methane released versus the total natural gas produced.
Complete visibility of all methane emissions must be measured and calculated — using emission factors is not enough and can understate or overstate your methane intensity. An accurate MI for a company requires aggregating and centralizing data across all assets to calculate a beneficial MI that can be compared against its peers. This complete view of methane will likely be necessary in light of new regulatory and corporate reporting requirements.
In order to meet the demands of investors and regulators, energy producers must have a plan to materially reduce their methane emissions and will likely need to hit targets that only industry leaders reach today. For reference, the top quartile of operators in Canada have an MI below 0.1%.
Where is your methane intensity?
Benchmarking your progress against peers is a great way to understand your methane intensity, especially as investors begin more heavily considering methane emissions. For example, in Alberta, public data is collected and released through Petrinex, and you can use it as a tool to see where you stand.
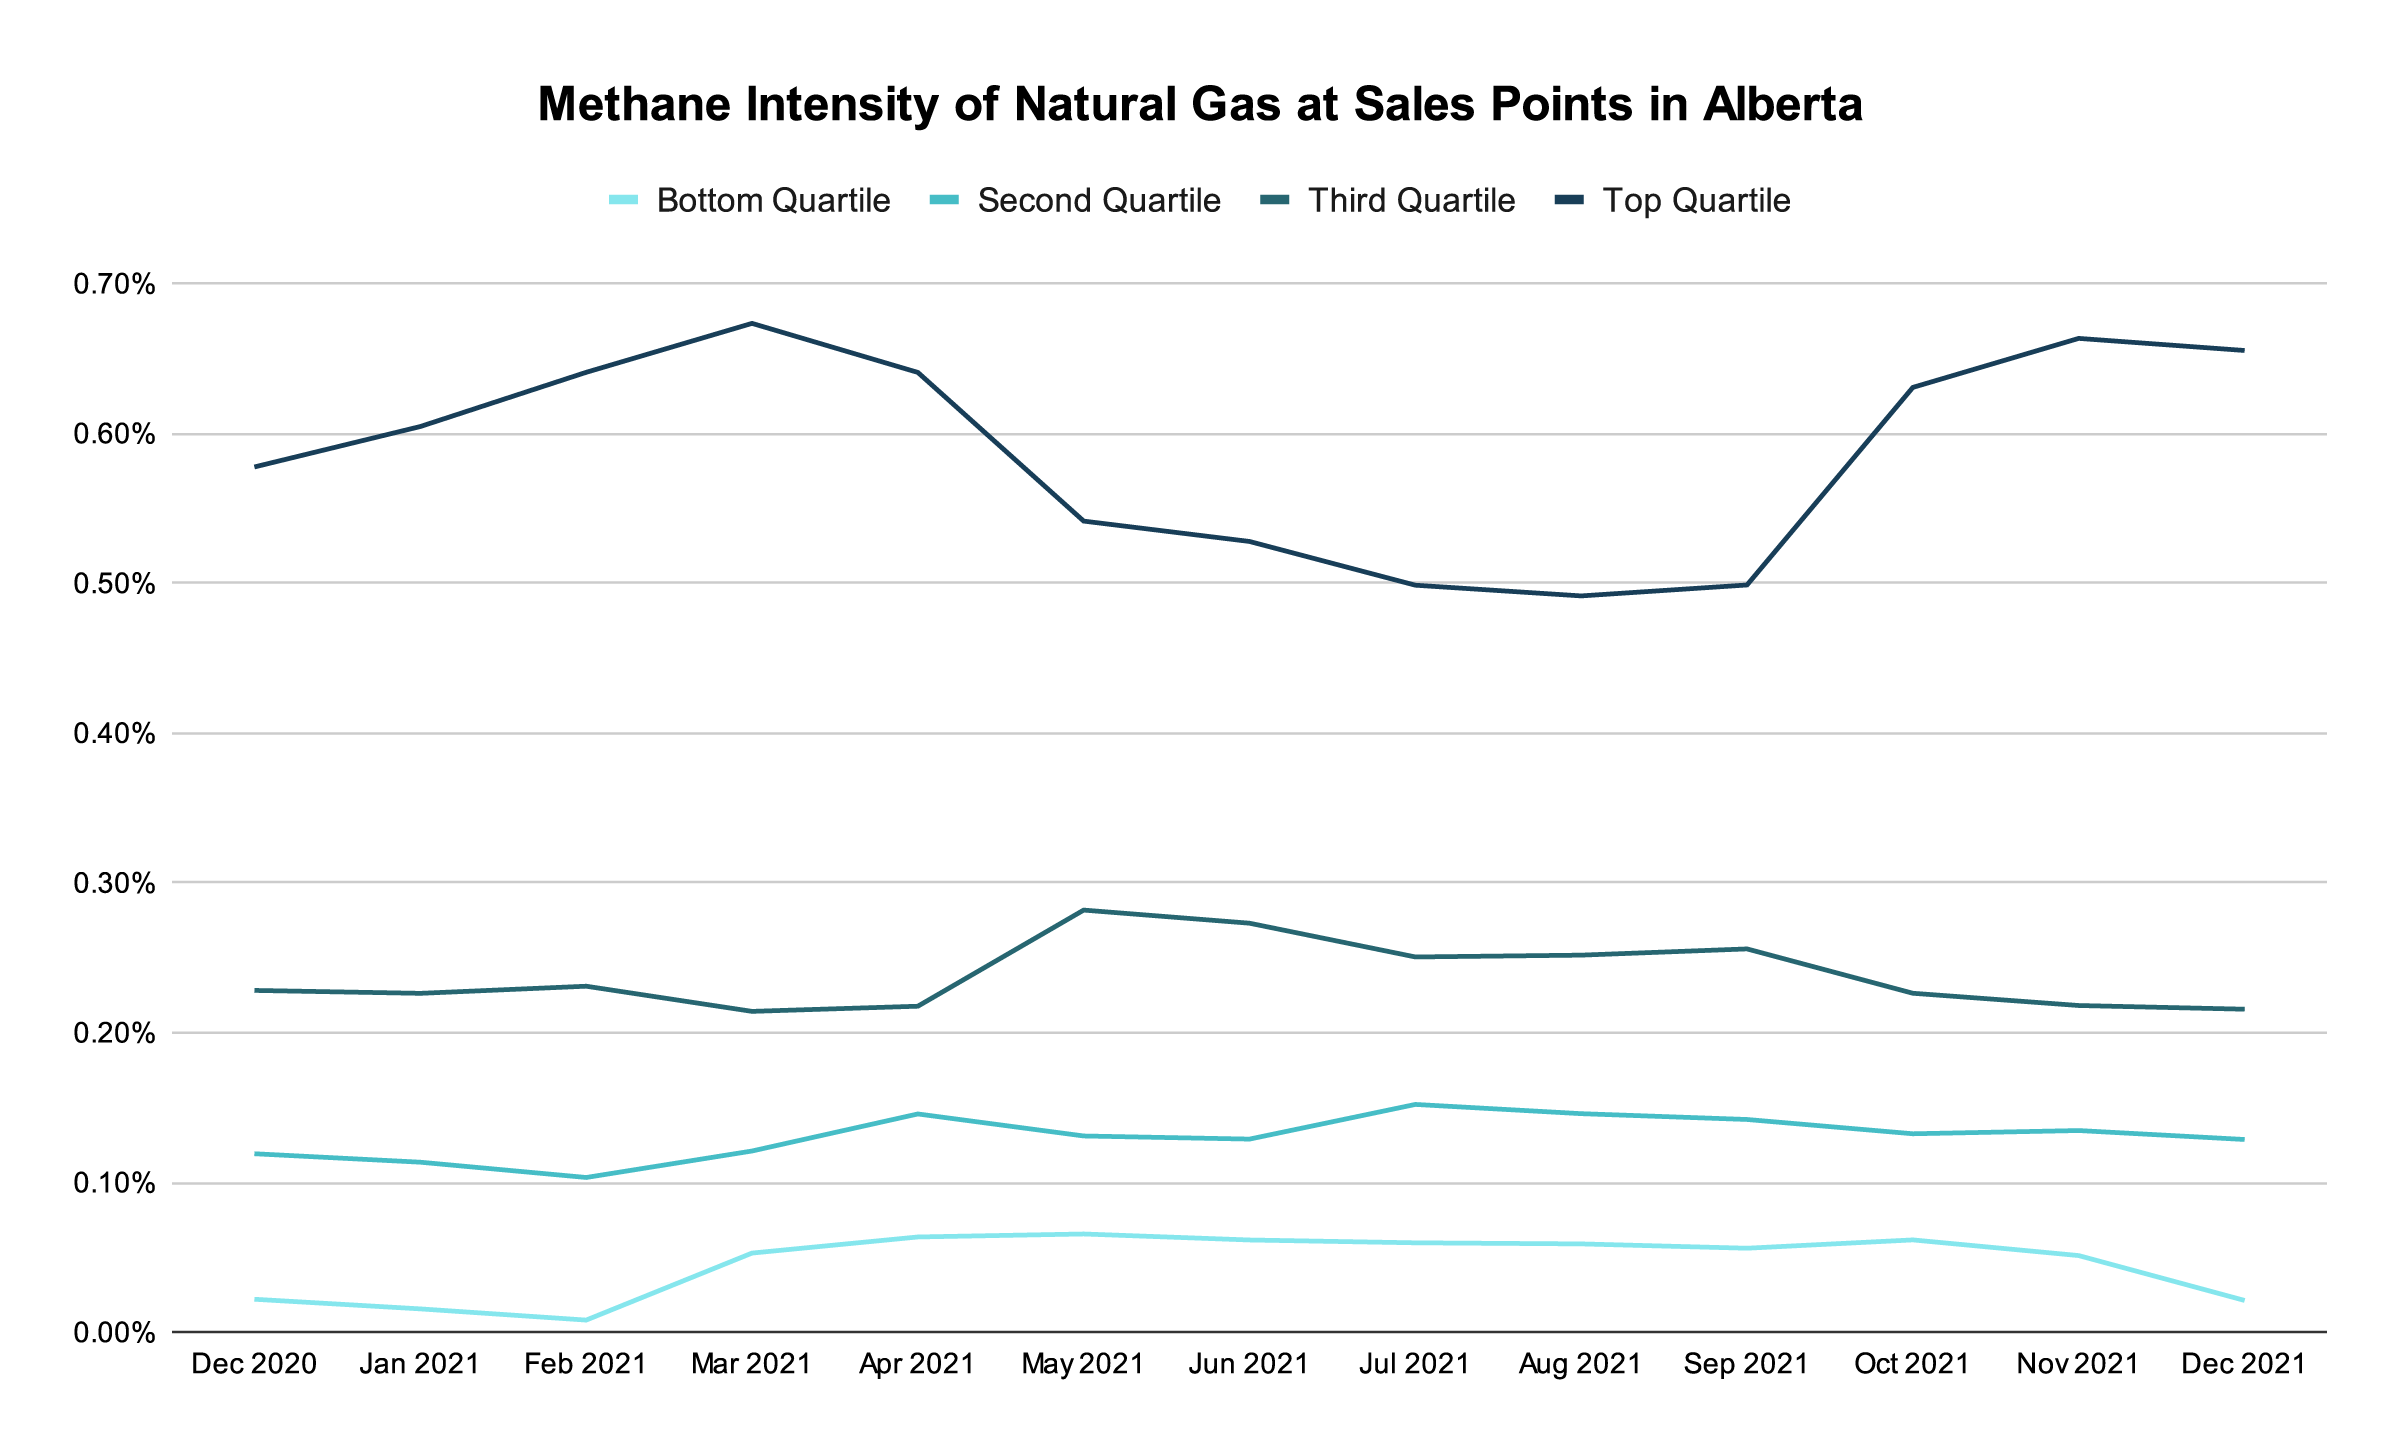
*Data based on publicly available data from Petrinex and calculations performed by Validere. MI is defined as the ratio of methane emissions to natural gas produced. MI % is attributed to the molecule’s well-to-sales-node path. Methane emissions include fuel, flare, and vent emissions reported in Petrinex; fugitive emissions are not reported in Petrinex.
Validere experts recently analyzed all of the publicly available Petrinex data in Alberta and calculated methane intensity at the sales point across the province. Our analysis found that a quarter of facilities in Alberta have methane emissions below 0.1% methane intensity. The data also shows that the next 25% of facilities are near the 0.1% threshold.
Facilities close to this threshold may simply need to optimize their operations to reduce their methane emissions to be among the lowest quartile of MI. To get to 0.1% and stay there, Validere provides operators with a foundational layer of visibility into their data, deriving insights and actions to manage methane emissions and more without making large capital expenditures or installing complex equipment.
Want to learn more about where you stand? Get in touch.